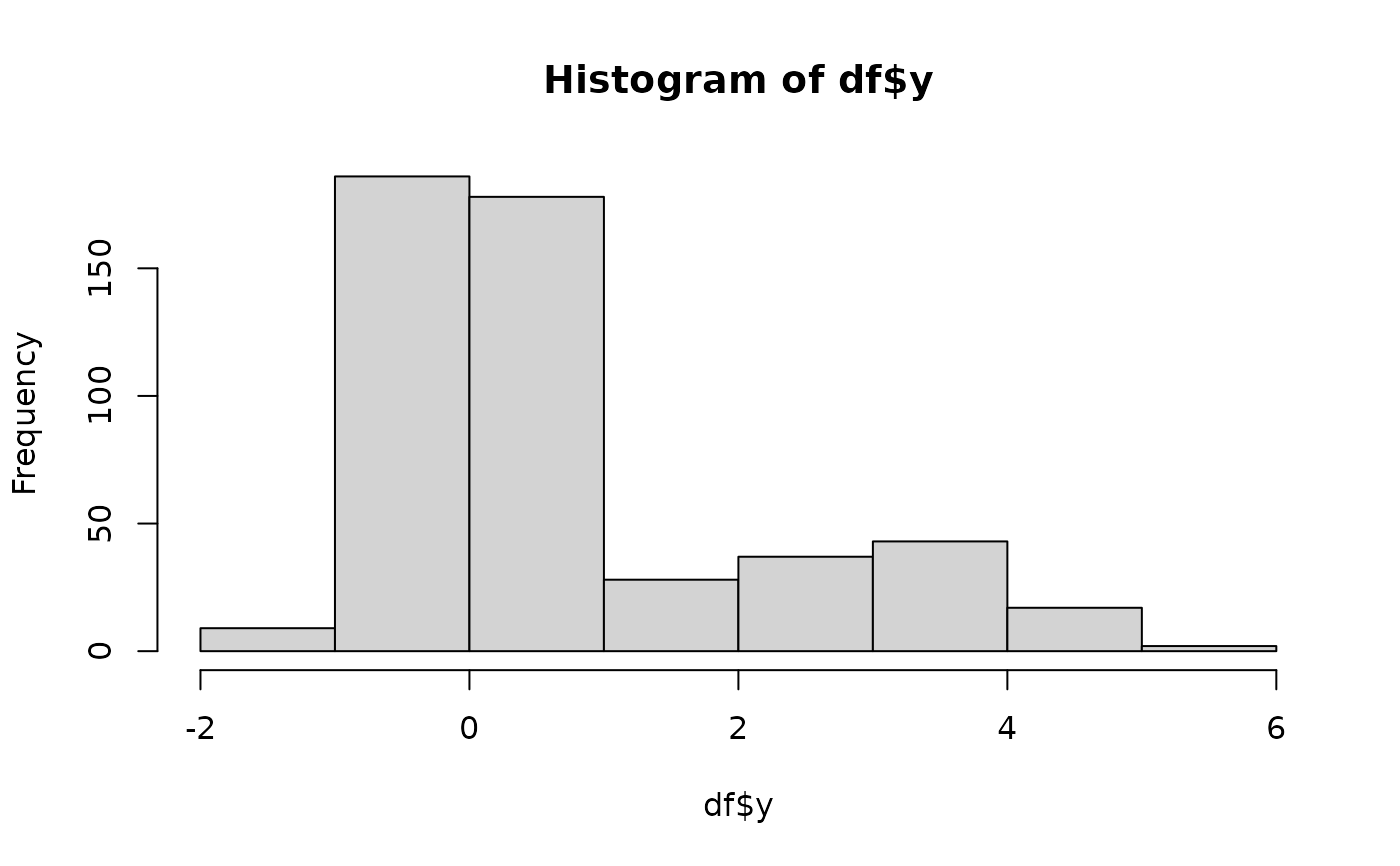
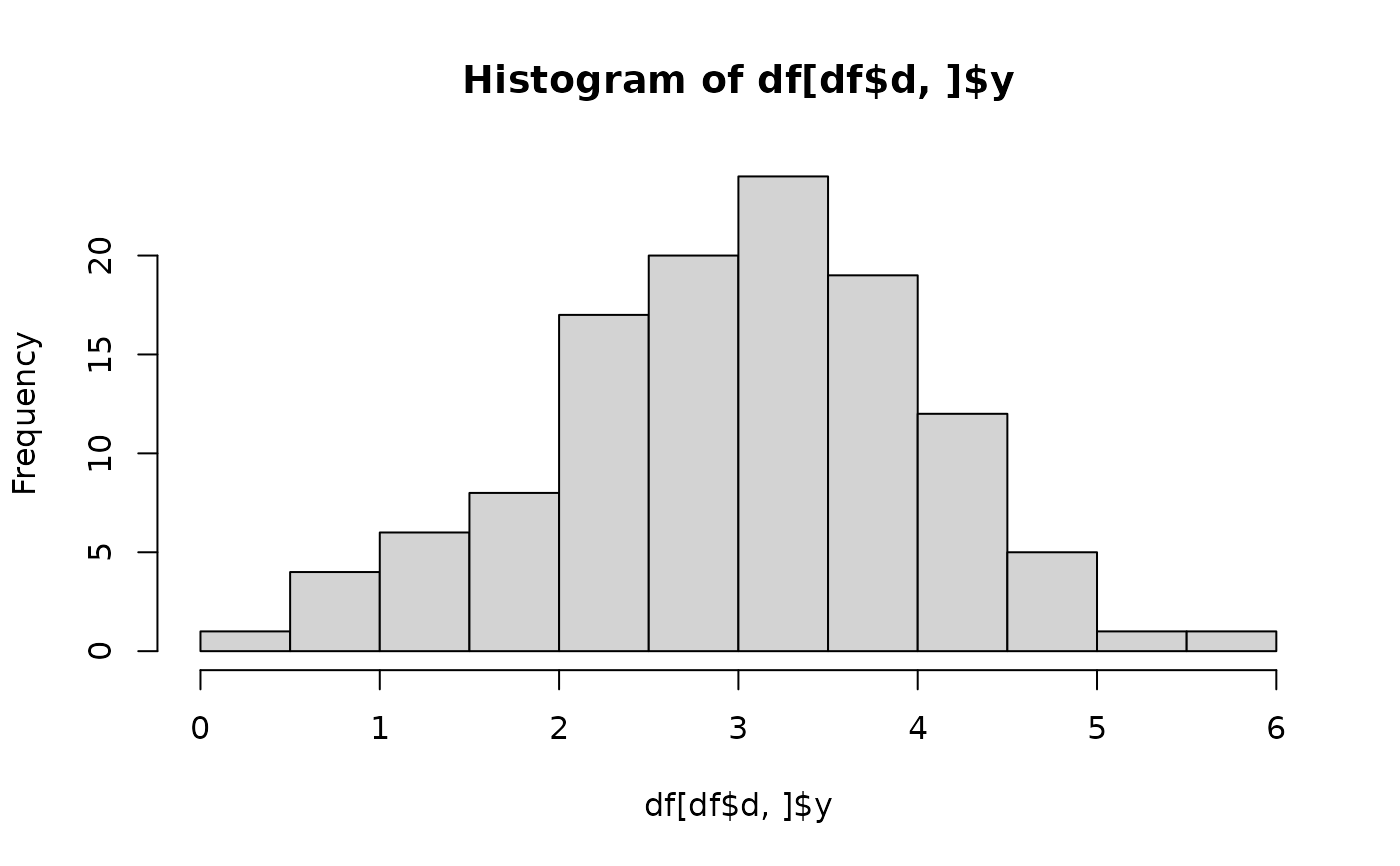
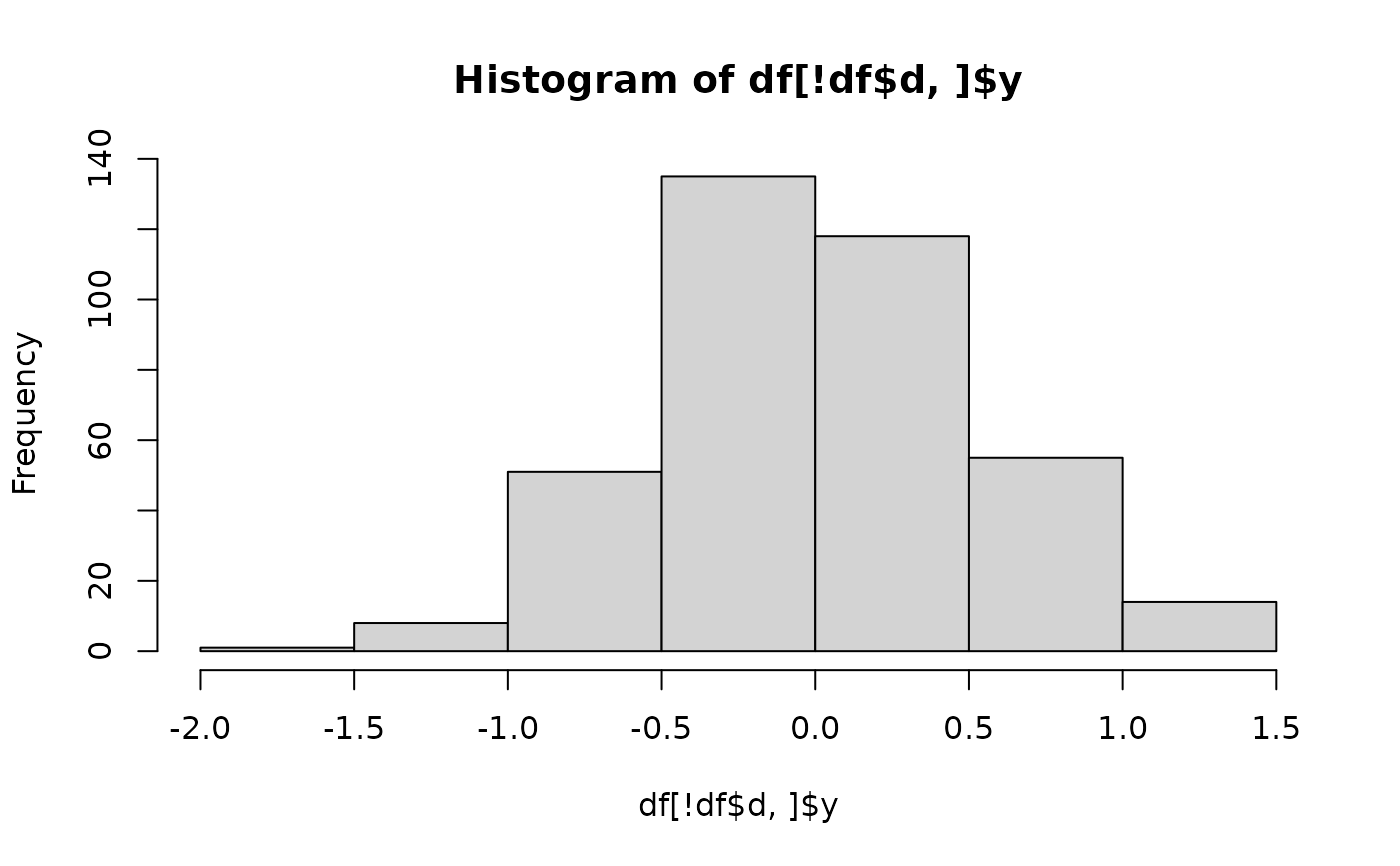
Simulate (randomly draw) numbers from a mixture of two normal distributions.
Source:R/mixture_of_two_normals.R
simulate_mixture_of_two_normals.RdSimulate (randomly draw) numbers from a mixture of two normal distributions.
Arguments
- n
A non-negative integer: the number of observations to simulate.
- groups
A character vector: a set of categories that differ in their proportions for the mixture. Specify
character(0)to have all observations in the same category, i.e. all observations have the same probability of coming from one component of the mixture or the other.- group_frequencies
A numeric vector of the same length as
groups, each value being the frequency of that group (as a proportion between 0 and 1).- mu_0
A number: the smaller of the means of the two normals.
- mu_1
A number: the larger of the means of the two normals.
- sd_0
A non-negative number: the standard deviation of the normal with mean mu_0.
- sd_1
A non-negative number: the standard deviation of the normal with mean mu_1.
- p
The probability of an observation coming from the normal with mean mu_1.
- sd_groups
A non-negative number: the standard deviation of the normal variability between regression coefficients for the groups (on a logit scale).